How to automate Time and Motion Study data collection
OEE sensors only show part of the picture
*Given strict non-disclosure agreements, we will be referring to our client as Company B throughout this article.
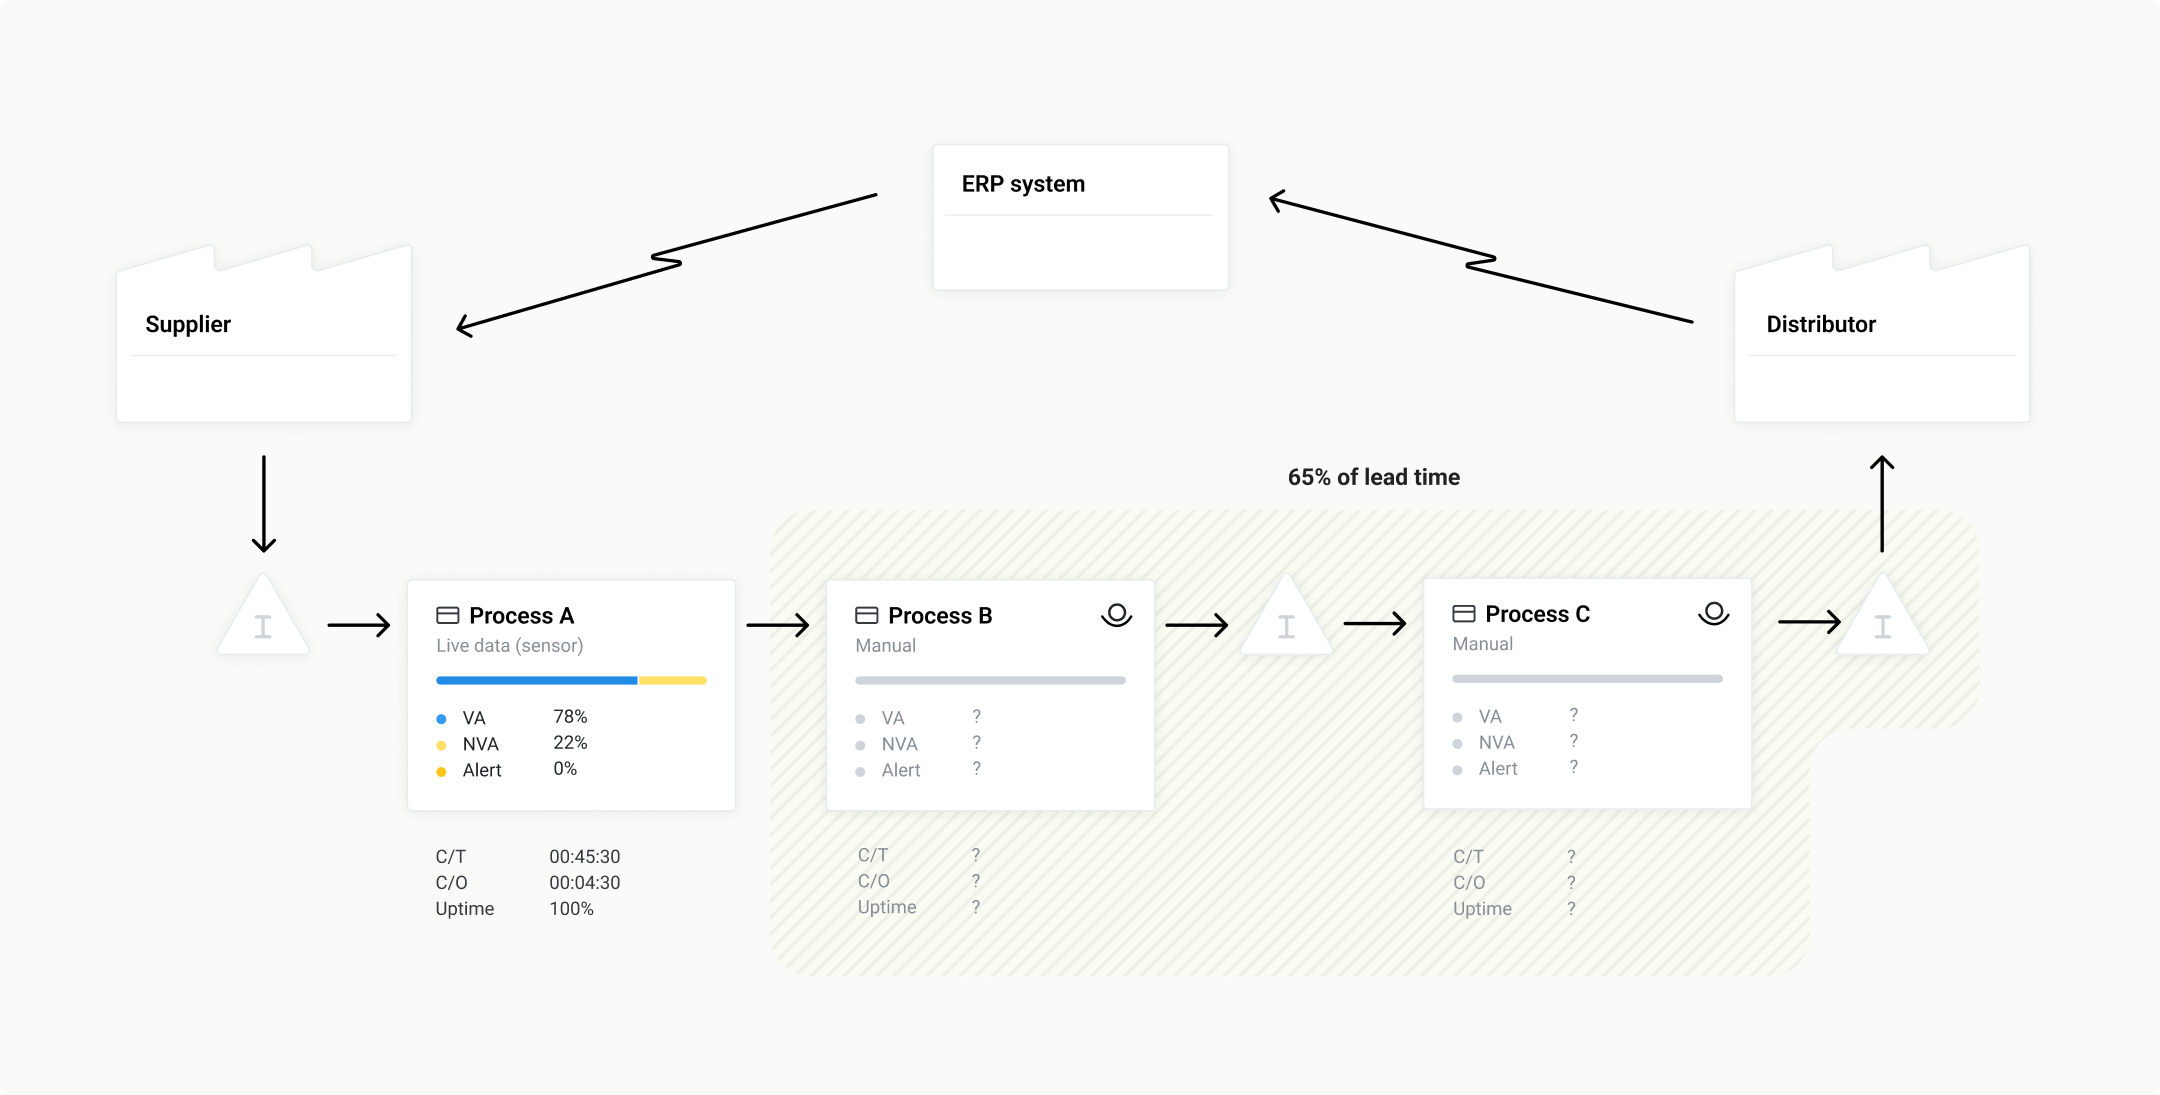
At Company B, one main products goes through a 3 step assembly process. The first step is run on an automated production line which has retrofit sensors on it to measuring OEE. The other two steps are manual assembly lines. When process engineers designed the flow, the designated Lead Time was 16.5 hours. At the time when Flowbase was introduced, it was taking 22 hours, naturally posing a big problem to sales and supply chain stakeholders.

They know the general Lead Time and the OEE of process A, but don’t have an understanding of processes B and C. The Process Engineer in charge of this project decided that the fastest path to improvement would be to analyse process B, as the progress in C can be controlled with buffer inventory.
The main reason for the lack of thorough process analysis was that Company B, while having a strong Lean culture, did not have enough resources for a full team of process engineers. As such, time-consuming activities such as time and motion studies needed to take a back seat.
Measuring and analysing can take up to 80% of the active time spent in the DMAIC cycle. Now though, with Flowbase, they can do quick analyses on large samples from multiple areas to a) prioritise the need for optimisation, and b) go into detail of different processes.
Step 1: collecting data
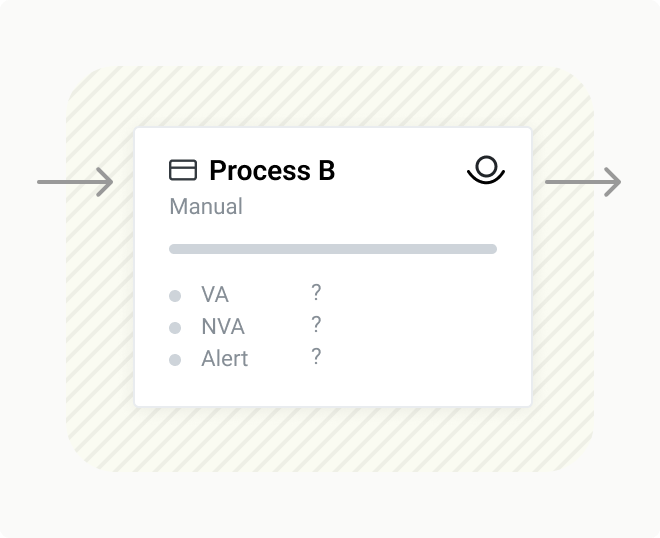
Specifically, Company B wanted to pilot with Flowbase on process B – an electronic control unit assembly station – which was sometimes seeing a lower yield than other stations.

In this station, one human operator controls multiple automated processes with different cycle times.
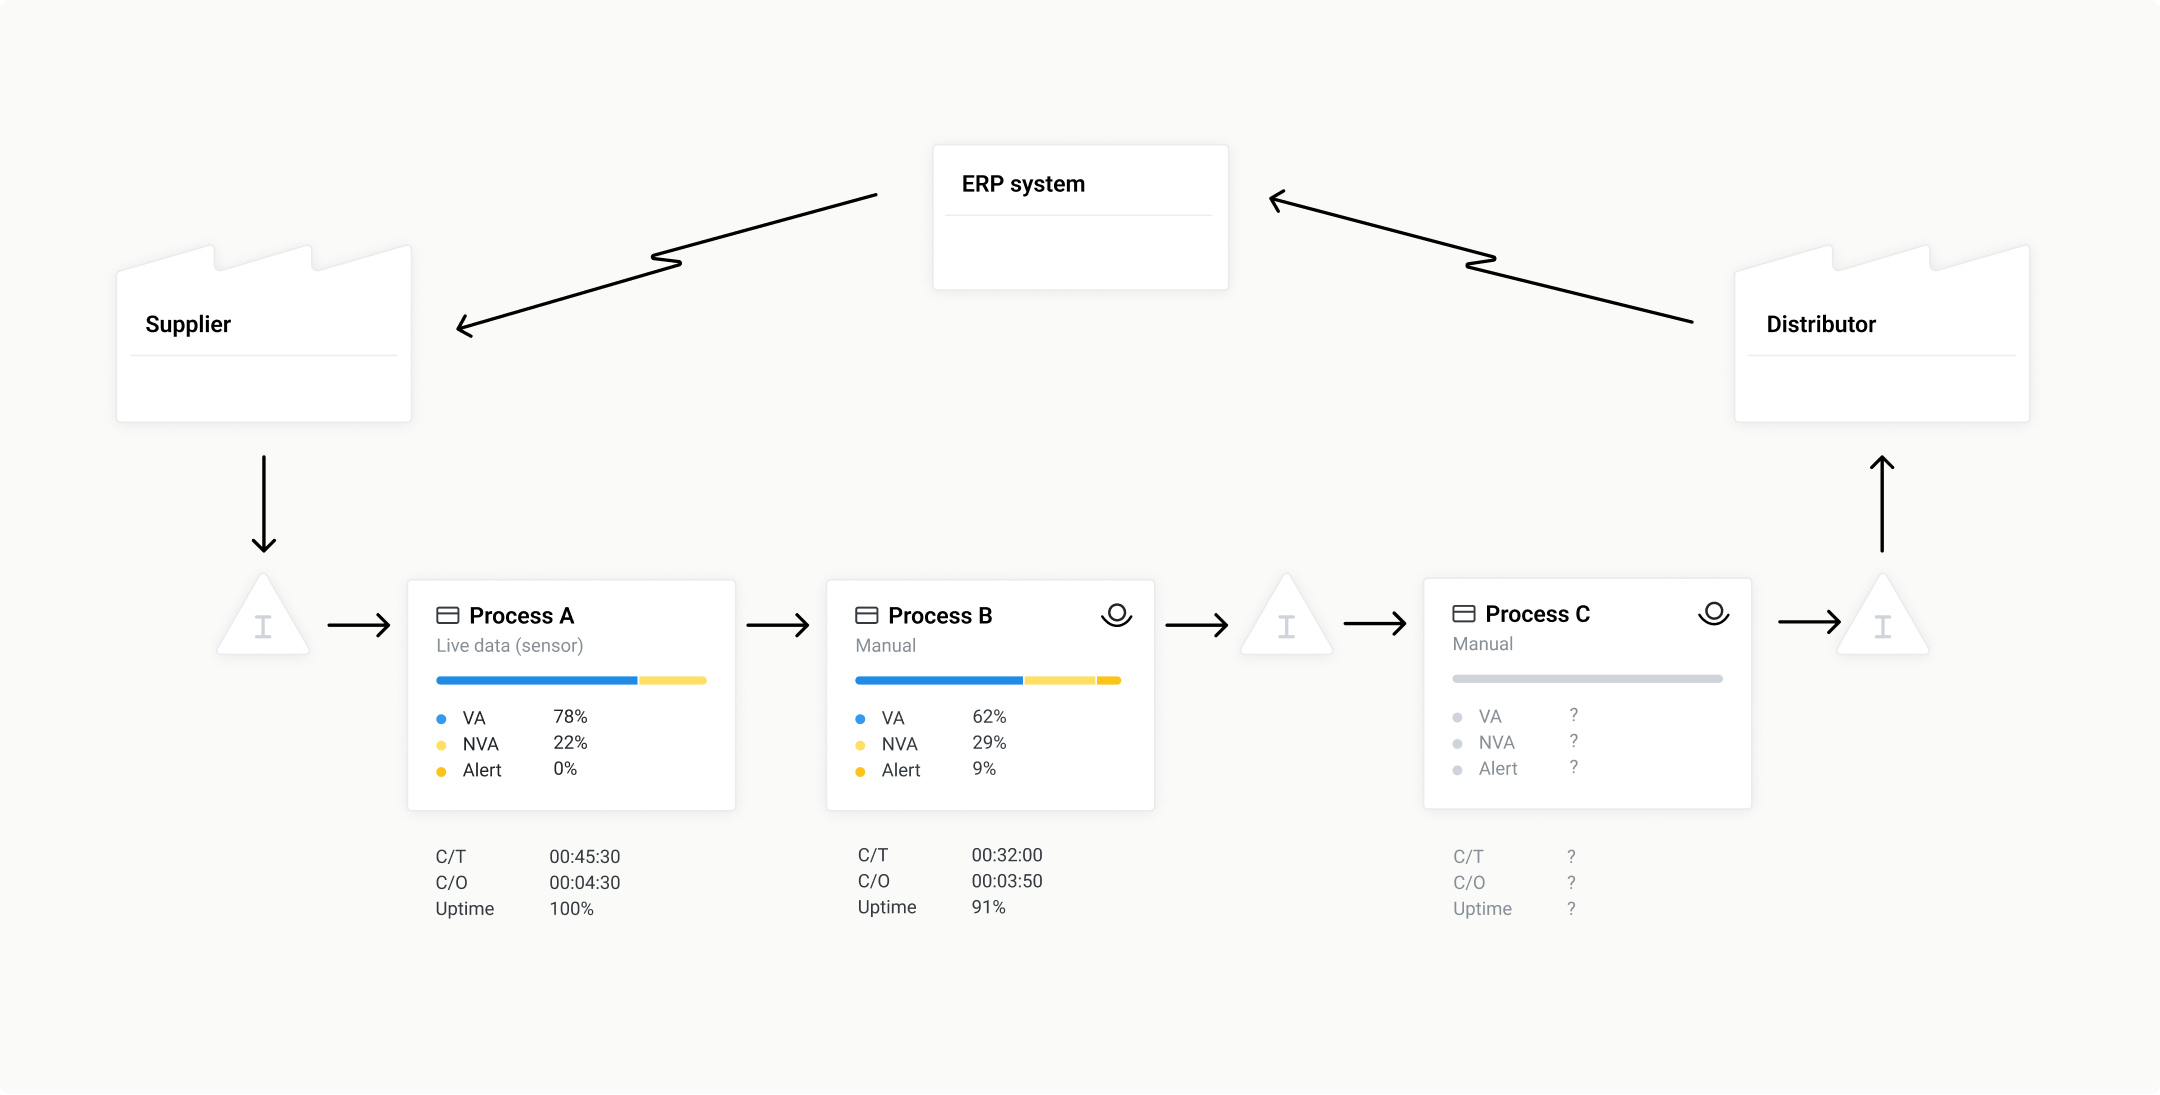
Pilot setup: 1 week worth of material (40h) was recorded with a camera at hand. This material was then uploaded to the Flowbase app. An automated GDPR-compliant computer vision system then analysed the data. Full Time and Motion Study data was then visualised on Flowbase dashboard, giving an overview of the assembly station OPE (overall process efficiency).
Main outputs: Production flow; Visual spaghetti diagram and heat map; Value added time; Availability loss; Performance loss and Timeline and Events graph
Looking at the timeline and events graph (graph 1.1) , some clear blocks of Non Value Added time stood out. This was a clear candidate for inspection. Looking at this data side by side with output from the automated inspection bench, it became clear that the stoppages were linked to faulty units – whenever an issue with a completed unit was diagnosed, we saw a stoppage of 10 to 20 minutes or more.

Step 2: corrective action
The next step was to modify the process – instead of the operator documenting the faulty unit and disassembling it during production time, a separate drop area was introduced. This meant that the operator could move the unit off the line immediately and normal production is continued. Corrective actions included:
Changing the production process flow.
Creating updated manuals for employees.
Optimising the workstation layout and installing a new container for faulty units.
Installing a QR code reader to scan faulty units.
Once the corrective actions were carried out and employees had received training, a temporary camera was set up to collect video for following the production process. The idea was to re-record the process and to see if instructions had been clear and the workstation better organised. This kind of re-assessment is wise for even the smallest changes, and it’s best to have a system in place to archive and retrieve historical benchmarking data.
Step 3: benchmarking the improved process
After implementing this change, Company B ran another benchmark on 120h of footage. Initial results are promising – the dark pattern following defective unit production is no longer there, and the percentage of Value Added Time as part of Planned Production Time is at 62%, up from 49% previously. The increase in productivity was followed through 3 weeks and was incremental. Another learning was that more thorough and process-tailored employee training is needed when changing processes.

“With the possibility to quickly undertake time studies from multiple workstations in parallel, our process engineers don’t need to spend time on annotating videos by hand. One of the more frustrating methods for production optimisation has become a one of the simplest.”
Company B is now able to review, optimise and benchmark all steps of the pilot process chain – an undertaking which previously would have taken up to 3-4 months, of which 70% was spent collecting and annotating data.“We can run a lot more tests now, and change our layouts much more often. The time we’re saving is going mostly into improving employee training and manuals. This is a big change for us.”

Learnings & next steps
The biggest surprise was that a lot of issues, predicted based on gut feeling alone, did not stand up to observed fact. “Frankly, we thought our instincts and expertise would be more accurate than they were. The ROI of having someone sit down and annotate video was too low for a company of our size, so we never commited the resources to it. What’s changed? Well, we can now carry out time and motion studies with a small team, but deliver results like a big corporation.”
This was only the first pilot in a long list of improvement projects at Company B. At Flowbase, we’re grateful to be working with them, and together we’ve set some next priorities:
Increase input data available from current systems to increase accuracy.
Look at other potential use cases such as buffer stock monitoring, getting more data out of the same one camera that is already installed
Add an additional camera to test and benchmark multiple processes in parallel
Insert benchmarked KPI’s to monthly reporting.