Value Stream Mapping (VSM)
Purpose
VSM is a powerful Lean tool. It is used for both, helping to create an implementation plan and for continuous improvement of Lean manufacturing. The main goal of VSM is to identify and eliminate muda (Japanese word for waste).(Manos, 2006) VSM lets you see the waste and what is more important, it enables you to identify the source of waste within the value stream. It also creates a common language when discussing manufacturing processes.(Rother & Shook, 1999) Improvement is achieved by first drawing a Current state map (CSM). CSM shows how the operation currently works, the current flow of materials and information. When sources of waste have been identified a Future state map (FSM) is drawn. FSM portrays the new and improved state that is to be achieved.(Frank, 2007)
Key terms
Value – defined from customer’s standpoint. In reality the price that a customer is willing to pay for the product or service;
Value stream – production system is to be viewed as a continuous flow of processes that add value to a product.;
Pull – instead of being pushed on to the customer, the product is pulled through the value stream at the customer’s demand;
Flow – product moves through the value stream to the customer at a constant pace of demand;
Perfection – the pursuit of eliminating waste in the system in order for the product to move through the flow of the value stream at the rate of demand.
(Abuthakeer, Mohanram & Kumar, 2010)
Methodology Step one
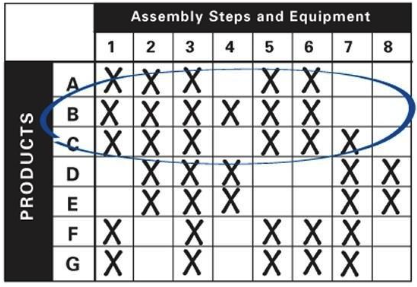
The first step to undertake is to select a product family you wish to map.(Manos, 2006) A product family is a group of products that take a similar path through the process and over same equipment in the downstream processes.(Rother & Shook, 1999) This can be done through a process family matrix, an example is illustrated in Table 2.2.

Step two
After choosing the product family, the necessary data is collected. It is important to collect fresh and new information, not historical data, as that might not be the reality at the moment and might lead to false conclusions.(Rother & Shook, 1999)
List of basic Lean measurements:
Cycle Time (C/T) – Time taken to complete one full cycle of work elements by an operator or the machine;
Lead Time (L/T) – Time taken for a part or product to move all the way through a value stream;
Value Added Time (VA) – Time of those elements of work that transform a product in a way so the customer is willing to pay for it;
Change over time (C/O) – Time taken to change a machine from one process to another.
(Rother & Shook, 1999)
Step three
After the necessary data is collected a CSM is drawn. An example of a CSM can be seen in Figure
2.11. The CSM shows us that the value adding activities (stamping, welding and assembly) have a total of 188 seconds as their value adding time (on Figure 2.11 this is marked as processing time). The product lead time is 23.6 days. This is due to the big inventory levels that can be seen in between the unconnected processes.

Step four
When a CSM has been drawn it must be analysed to draw a FSM. To draw a future state map first we need to calculate the takt-time (T/T), this is done to introduce continuous flow. Takt-time is a measure that determines how often it is needed to produce a part or a product to meet customer demands.(Rother & Shook, 1999) The formula for calculating takt-time is:
T/T = Available Working Time / Customer Demand
After takt-time is calculated continuous flow is introduced. The idea of this is that the process never stops and the part or product continuously moves through the value stream without stopping in buffer inventories. This increases the response time to customers and increases the quality of the product.(Womack, 2006) Yamazumi board is a good and simple tool for introducing continuous flow and balancing process times. An example of a yamazumi board can be seen in Figure 2.12.


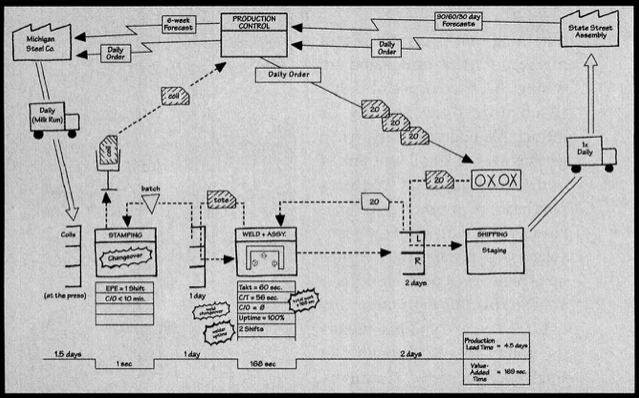
The FSM of the example in Figure 2.11 can be seen in Figure 2.13. As seen from the FSM bot lead time and value added time (processing time) have decreased. The lead time is now 4.5 days instead of the previous 23.6 days and the value added time has decreased from 188 seconds to 169 seconds.

To sum up
These are the main methods for using VSM, there are of course a lot of other tools that are used in Lean Six Sigma. You can read about some of them in our type: entry-hyperlink id: 3DKsRqaedceIqm5GR9Dt7X article.
Flowbase can help with several steps within implementing LSS in your organization. At Flowbase we have automated time and motion study (VSM) annotation, data collection and analysis. Flowbase uses computer vision and AI to automatically analyse any video footage that you upload, enabling you to easily analyse multiple material flows in parallel. All resulting data is gathered to a single dashboard and searchable indexed reports – and if you’re keen to see why the timeline looks the way it does in a particular place, then you can easily refer back to the original video footage. Now, if your production manager wants to compare benchmarks, then it’s a click away. All data is visualised automatically in an easily understandable manner, with historical data and improvements (or regressions) available for each process. If you need to drill down into more detail, then detailed by-the-second data is available in detailed process reports.
Throughout these articles, we'll refer also to type: entry-hyperlink id: 29QVDL5cMGk35bMHOY8g19 which you are welcome to look up. We update our sources on an ongoing basis.