Save more than €500'000 a year by keeping tabs on your factory floor health
Problem: Semi-automatic and manual line utilisation is not known precisely and it is not clear where the waste is. No actual understanding how much movements are undertaken, and, critically, why. This evidently has a significant negative effect on line utilisation.
Task: Create a KPI for workstation utilisation. Help measure and track the causes of KPI fluctuation.
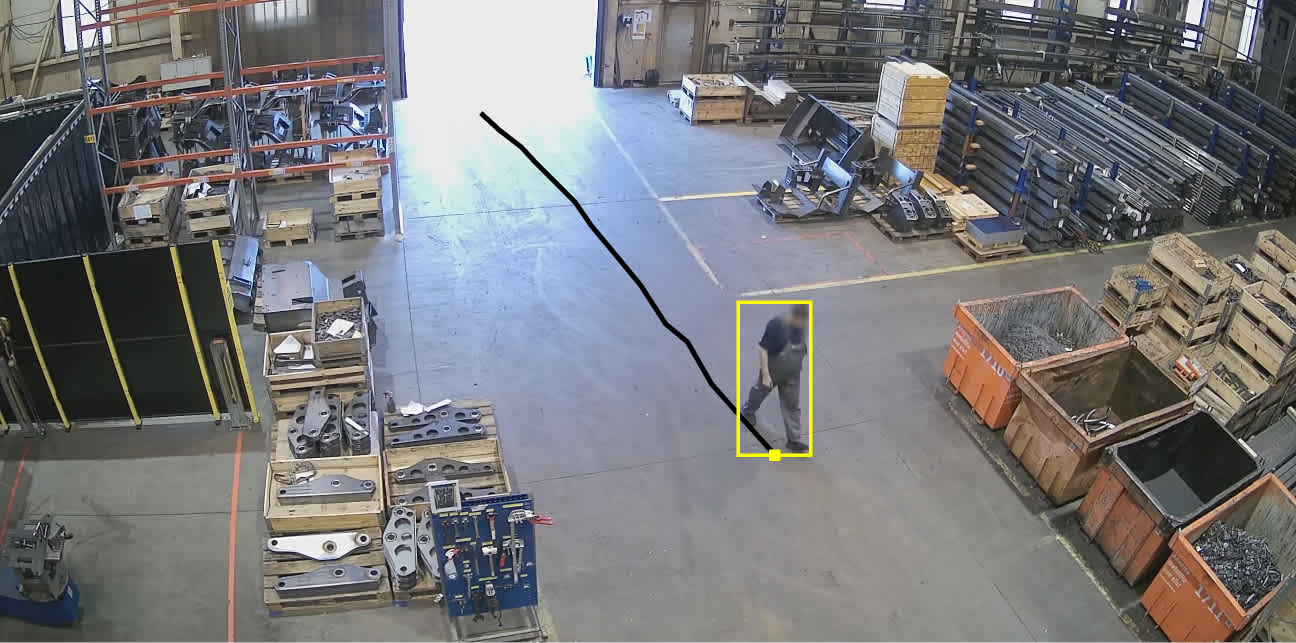
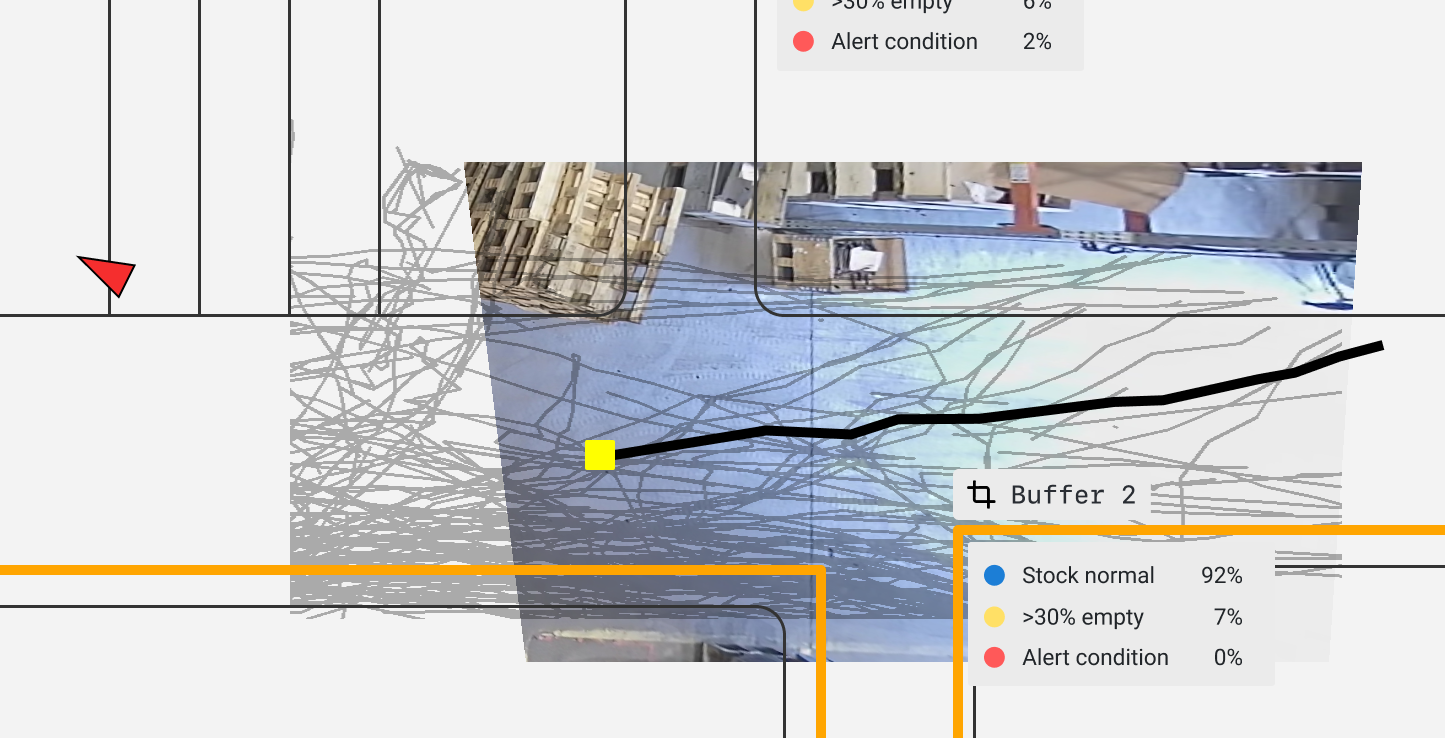
Solution: Implement a network of cameras working together to draw all movement pathways across a facility, in a consistent and privacy-aware way. Analyse this dataset for workstation utilisation data; identify movement patterns per product group and zone; establish time spent in transport as a manageable KPI.
Result: Year one efficiency increase of 17.2%. Final goal of more than 500 000€ of waste turned into value added time.
---
Waiting and transportation waste across a large facility can have a massive effect on your production efficiency. However, mapping it all can be a real hassle.
What if you could shave 30 minutes off each employee’s transportation time? This could mean hundreds of thousands of euros per year, not to mention the gains from up to a 30% increase in efficiency.

This was exactly the initial brief with one recent customer.
We started by mapping out overall workstation utilisation and movement flows on the factory floor.
In a 20’000m² factory this would normally be a daunting undertaking. One option would be to draw spaghetti diagrams, in an attempt to identify and map all movements. Next, you would need to collect the time people spend in their workstations – this can be done with a stopwatch or employees registering their time into time-tracking systems. This is not a reliable system and can be tedious and extremely capital heavy. It is also something you would not do very often as it is a long process.

In contrast, we are utilising camera infrastructure and computer vision to map everything live. We are able to provide our customer with a trackable KPI which is now a talking point in monthly management meetings, and one that can directly be targeted with experiments and actions. We call this factory floor health!
We take the video feed from the camera, obfuscate it, run it through our algorithms and delete the source video. The information from the video is translated onto the factory floor-plan and you get a 2D overview of all the paths from 3D data. We provide the actual times spent on transporting and waiting on materials. This in turn – especially when combined with production schedule data – gives vital insights into potential savings.
As with all projects, we set up the whole system for our customer and helped to integrate it to their ERP with little to no effort from them. They got a new KPI which they can consistently follow and which updates automatically. Thanks to a high degree of automation and white-glove support from Flowbase, the entire project was comfortably handled by a single engineer from the client’s side. They saved time per employee throughout their factory floor, added up to a year one efficiency increase of 17.2% . Our next goal is to reduce it further to finally reach the 22x ROI with more than 500 000€ of saved time and money.